QPR, rebuilt: finding wines worth buying
Why the old quality-price ratio lied about both the cheapest and the greatest bottles, what wine economists do instead, and how the new QPR works.
By Boris
A score answers one question: is this wine good, in my opinion. A price answers another: can you afford it. But the question I actually get asked, and the one I ask myself in a shop, is a third one: is this wine worth buying?
For a single bottle you do not need any math for that. You look at the score, you look at the price tag, you shrug or you nod. But I keep notes on more than 2,700 priced and rated wines, and at that scale intuition stops working. When someone asks for "the best buys of the year", or when you sort the catalog hoping to find the underpriced gems, you need a number. That number on this site is called QPR, quality-price ratio.
This is the story of how the old QPR quietly lied to us, what the wine economics literature says about measuring value, and how the new one works. The first half is safe for anyone who just drinks wine. The second half has formulas, because I could not help myself.
What QPR used to be
The old QPR was a formula I wrote years ago, and it looked like this:
Here is my score on the 0 to 5 scale, is the shop price in hryvnia normalized to a 750 ml bottle, and is a multiplier: 1600 for most wines, 2500 for traditional-method sparkling, because Champagne genuinely costs more to make. is the gamma function standing in for a factorial, and is the golden ratio, which is there for no defensible reason beyond the fact that I studied math and nobody stopped me.
Silly as the dressing looks, the intent was right, and I still stand by it. The difference between a 2.9 and a 3.0 wine means nothing to me in money terms: I do not want either. The difference between a 3.9 and a 4.0 is a league boundary. A quality scale is not linear in price, so the formula rewarded score superlinearly: at a fixed QPR, a wine half a point better "justified" roughly seven to eight times the price. And the multiplier was really a willingness-to-pay anchor in disguise: it was tuned so that a threshold wine, a 3.8, at a fair 2021 price, read as roughly 1.0.
Where it broke
Three cracks, from embarrassing to fundamental.
First, inflation. The formula divided by a hryvnia price and the anchor was frozen in 2021 money. Then the market moved: the going rate for my threshold-quality wines went from about 650 UAH in 2022 to about 1,500 UAH in 2025. The whole scale sagged. A perfectly fair 3.8 at today's price read as below-average value, and "QPR 1.0" stopped meaning anything you could act on.
Second, the currency wall. QPR only computed for UAH-priced wines, so more than 200 bottles priced in euros, pounds, or Moldovan lei had no QPR at all. Wines I bought in Vienna or Chisinau simply did not participate in the value conversation.
Third, and this is the one that forced a rethink rather than a recalibration: the number had quietly stopped measuring value at all. I made the quality reward so convex that it overpowered the price entirely; across the catalog, the correlation between the old QPR and price was almost exactly zero. The metric was mostly my score wearing a costume. A legendary Burgundy scored 5.0 at $1,382 read as above-average value (1.45 against a catalog median of 0.83), and a $5 supermarket sparkling scoring 3.6 read above average too (1.05). I would score that Burgundy lower today, which only sharpens the point: the number was tracking my enthusiasm, not the price. A value metric that can flag neither a luxury premium nor ordinary cheapness is not a value metric. And the fix is not a better exponent: any formula of the shape quality divided by price measures a bottle against zero, when the only comparison that means anything is against its peers.
You can see why no ratio can survive contact with this market. Here is the catalog, thinned to one dot per wine or two so the page stays light, score against price, with the price axis logarithmic:
The cloud climbs like a staircase that gets steeper with every step: the price of quality is convex. Each extra tenth of a point costs more than the previous one, and near the top it costs a lot more. Divide a convex curve by a straight line and you get exactly the two lies above: everything expensive looks bad, everything cheap looks good.
What the wine economists do
It turns out this problem has a literature, and the literature has a verdict.
The standard tool is a hedonic price model: regress price on the things that plausibly drive it (quality score, region, style, age), and treat the fitted value as what a wine like this normally costs. The interesting part is the leftover. The residual, actual price minus expected price, is the mispricing: negative means underpriced, positive means overpriced. Value is not quality per dollar; value is the gap between what you pay and what wines of that quality go for. Priilaid and van Rensburg, who built exactly such models for South African wine, put the consequence beautifully:
fertile areas for bargain hunting can thus be found at the top end of the price continuum as much as at the bottom
A few results from that literature shaped the rebuild:
- The quality-to-price relationship really is convex, close to exponential. The most thorough specification comparison I found, Oczkowski (2020), runs a horse race across four markets and the log-quadratic form wins in all of them, with the squared quality term positive and significant. In plain words: dollars per quality point rise as you climb. My old formula got that part right.
- The going rate is roughly 5 to 8 percent more price per rating point. Kaimann and coauthors (2023) measure about 8 percent on nearly 14,000 observations covering some 8,400 wines; a meta-analysis of 223 studies by Nunez and coauthors lands on 5 to 6 percent once publication bias is corrected.
- One curve does not fit the whole market. Costanigro, McCluskey and Mittelhammer (2007) show that attribute prices differ across price segments not just in size but in sign, and formally reject pooling; quality bites hardest in the fine-wine segment. Everyday wines and collectible wines are, statistically, different products.
- A raw quality-to-price ratio has no defenders that I could find. The practitioner literature dismisses it just as bluntly as the academic one.
So the principled design is: model the expected price for a wine of a given quality, then score each bottle by how far its actual price sits from that expectation. A wine priced exactly at its quality-implied expectation is neutral value, whether it costs $5 or $1,400. That single property fixes both of my edge cases at once.
The rebuild
The new QPR does this in the simplest form that survives contact with a 2,700-wine personal catalog.
Step one: a stable price basis. Every wine now carries a USD price converted from its shop price at the moment the price was captured, using the central bank rate of that day (NBU for hryvnia, ECB for the rest). Freezing the conversion at the capture date is the point: a price recorded in 2022 stays a 2022 price, and hryvnia inflation stops silently rewriting history. This also demolished the currency wall: every priced wine, in any currency, now participates.
Step two: an expected price per quality tier. Rather than fitting a regression through 2,700 noisy points, I bucket my scale at boundaries that mean something: most of them come from how I score (3.8 is my purchase threshold), but the top one the data drew itself. Prices above 4.5 are bimodal in this catalog: still wines I score 4.5 cluster around $78, and from 4.6 up everything jumps onto a $250+ icon shelf. A single tier straddling that gap had its median sitting in the empty valley between the two groups, which made it the least stable number on the ladder, so the top splits at 4.6 and the icons keep to themselves. For each tier, the expected price is the median USD price of the ordinary still wines in it. Bucketing instead of curve-fitting is not a cop-out, by the way: the same Priilaid and van Rensburg paper found that modeling quality in discrete steps materially outperformed a smooth linear fit, precisely because the steps capture the acceleration.
The ladder, as computed from the live catalog today:
There it is again, the staircase from the scatter plot, now as an explicit price expectation. A wine I would score 4.0 to 4.3 typically runs about $39; anything 4.6 or above typically runs about $257. That more-than-six-fold jump is not an opinion about what quality should cost. It is a measurement of what it does cost.
One refinement keeps the steps from becoming cliffs. A flat plateau per tier would mean a 3.9 expects the same peer price as a 3.8, and, worse, that value jumps discontinuously at every boundary: a 4.29 and a 4.31 would live in different worlds. So each tier contributes an anchor instead, its average score paired with its median price, and the expected price interpolates between neighboring anchors, linearly in log price, which is just the literature's percent-per-point rate held constant between anchors. Outside the anchors the curve goes flat, and the everything-else bin below 3.5 keeps its flat median, because down there price carries no quality signal anyway (the fine print explains why). The staircase becomes a piecewise curve, built from nothing fancier than medians and averages, and a 3.9 now expects more than a 3.8, as it should:
Step three: styles that are honestly dearer. Traditional-method sparkling, fortified wines, and sweet or semi-sweet wines cost more to make than still table wine, so comparing a Champagne to the still-wine median would tax it for its own production method. Each style gets a factor measured the same way, as the score-matched price ratio against baseline wines: 1.69 for traditional method, 1.20 for fortified, 1.20 for sweet. I would have guessed sweet wines closer to Champagne, but the data disagreed with me, and the data collects fewer opinions.
Step four: bottle formats. A half bottle is not half the price of a full one: glass, cork and label refuse to scale down, and magnums carry a collector premium. Normalizing every price to 750 ml is the right way to compare wine, but it quietly taxes small formats for their packaging. Measured against same-league full bottles in this catalog, halves run about 1.7 times the per-liter price and magnums about 1.25; the factors are set a notch conservative, at 1.5 and 1.25. The in-between sizes, the 500 ml of sweet wine or the 620 ml clavelin, stay neutral: those are the native formats of sweet and fortified styles, their premium already lives inside the style factor, and counting it twice would be cheating. The poster child is Burlotto's Barolo in half bottle: $47 for 375 ml is a dear-looking $94 per 750, and the flat math called it pricey, but halves of serious Barolo simply cost that, and it now sits where it belongs, at fair.
Putting it together:
where is the anchor-interpolated expected price: with anchors ordered by score,
clamped flat outside the anchor range.
Read it as: the price a wine like this normally commands, at its exact score, in its style, in its bottle format, divided by the price this one actually asks. QPR 1.0 means fairly priced for its quality. QPR 2.0 means you pay half of what its peers cost. QPR 0.5 means you pay double. The anchors refresh daily from the catalog, so as the market moves, the definition of "normal" moves with it and the expectation can never go stale the way the old 2021 constant did.
One score, three different answers
The best illustration comes from three traditional-method sparklings I scored 4.5: same quality in my book, same style, same 1.69 factor, so everything cancels except the price tag. On the old scale they came out near 3.2, 1.4 and 0.8: the right order, but the wrong story, because the middle one is not a great deal and the last one is not roughly average. The new one has opinions. Prices below are per 750 ml.
| wine | score | price | QPR |
|---|---|---|---|
| Ca del Vent Sospiri Pas Opere | 4.5 | $36 | 3.72 |
| Egly-Ouriet V.P. Grand Cru | 4.5 | $165 | 0.80 |
| Louis Roederer Cristal 2015 | 4.5 | $543 | 0.24 |
Same score, same style, three completely different purchase decisions. The Ca del Vent, at nearly four times under its league, is exactly the anomaly this whole system exists to surface. The Egly-Ouriet V.P. sits right on the fair line: a grower icon priced like the league it plays in, not a deal and not a rip-off. The Cristal asks more than four times the going rate; it is lovely, it is famous, and the label is doing a lot of the lifting - now the number says so instead of mumbling.
Zoom higher up the ladder and the same spread repeats at every rung:
| wine | score | price | QPR |
|---|---|---|---|
| Giacomo Borgogno Barolo Riserva 1967 | 4.9 | $138 | 1.86 |
| Egly-Ouriet Les Crayeres Blanc de Noirs | 4.9 | $377 | 1.15 |
| Lopez de Heredia Tondonia Blanco Gran Reserva | 4.8 | $129 | 1.99 |
| Roses de Jeanne Les Ursules 2016 | 4.7 | $57 | 6.27 |
| Salon Le Mesnil 1997 | 4.7 | $989 | 0.36 |
| Roumier Chambolle-Musigny Les Cras | 4.7 | $1,057 | 0.20 |
A sixty-year-old Barolo Riserva, bought in euros the old formula refused to even look at, still undercuts its league by almost half. Full disclosure on that one: we pulled it from an old private cellar this year, and bottles like that are always a gamble - they arrive transcendent or they arrive dead, and the price is low partly because the seller shares that risk. Once in a while you win. Old vintages also enjoy a structural tailwind here: the ladder expects a 4.9 to cost what 4.9s cost today, so decades of cellaring ride along free. Treat library-release steals with a gambler's respect. The Egly-Ouriet Crayeres is the residual thesis in one row: $377 and genuinely not overpriced, because that is simply what the top league costs. Les Ursules is the economists' promise made flesh; remember "fertile areas for bargain hunting at the top end of the price continuum"? There it is, a cult grower Champagne at about a sixth of its league's rate. It is also a confession: I bought it before the market decided Roses de Jeanne was a cult, and the stored price remembers that moment, just like my early Ulysse Collin bottles remember the days they cost around a hundred dollars. A big QPR sometimes means the wine is underpriced today, and sometimes means I got there before the crowd. The number cannot tell you which; the price date in the hover can. And at the bottom sit Salon and Roumier, wonderful wines asking three to five times the going rate, where the name is the product.
The style factors earn their keep the same way: Barbeito Malvasia Single Cask 83, a 4.5 fortified Madeira at the equivalent of $39 per 750 ml, lands at 2.44. Under the old formula its fortified nature was invisible; now it is recognized as a properly costly style selling far below what 4.5-tier wine goes for. And for the record, the one bottle on this site I still call a perfect 5.0, Stella di Campalto Sasso, lands at 1.04: greatness, priced exactly like greatness.
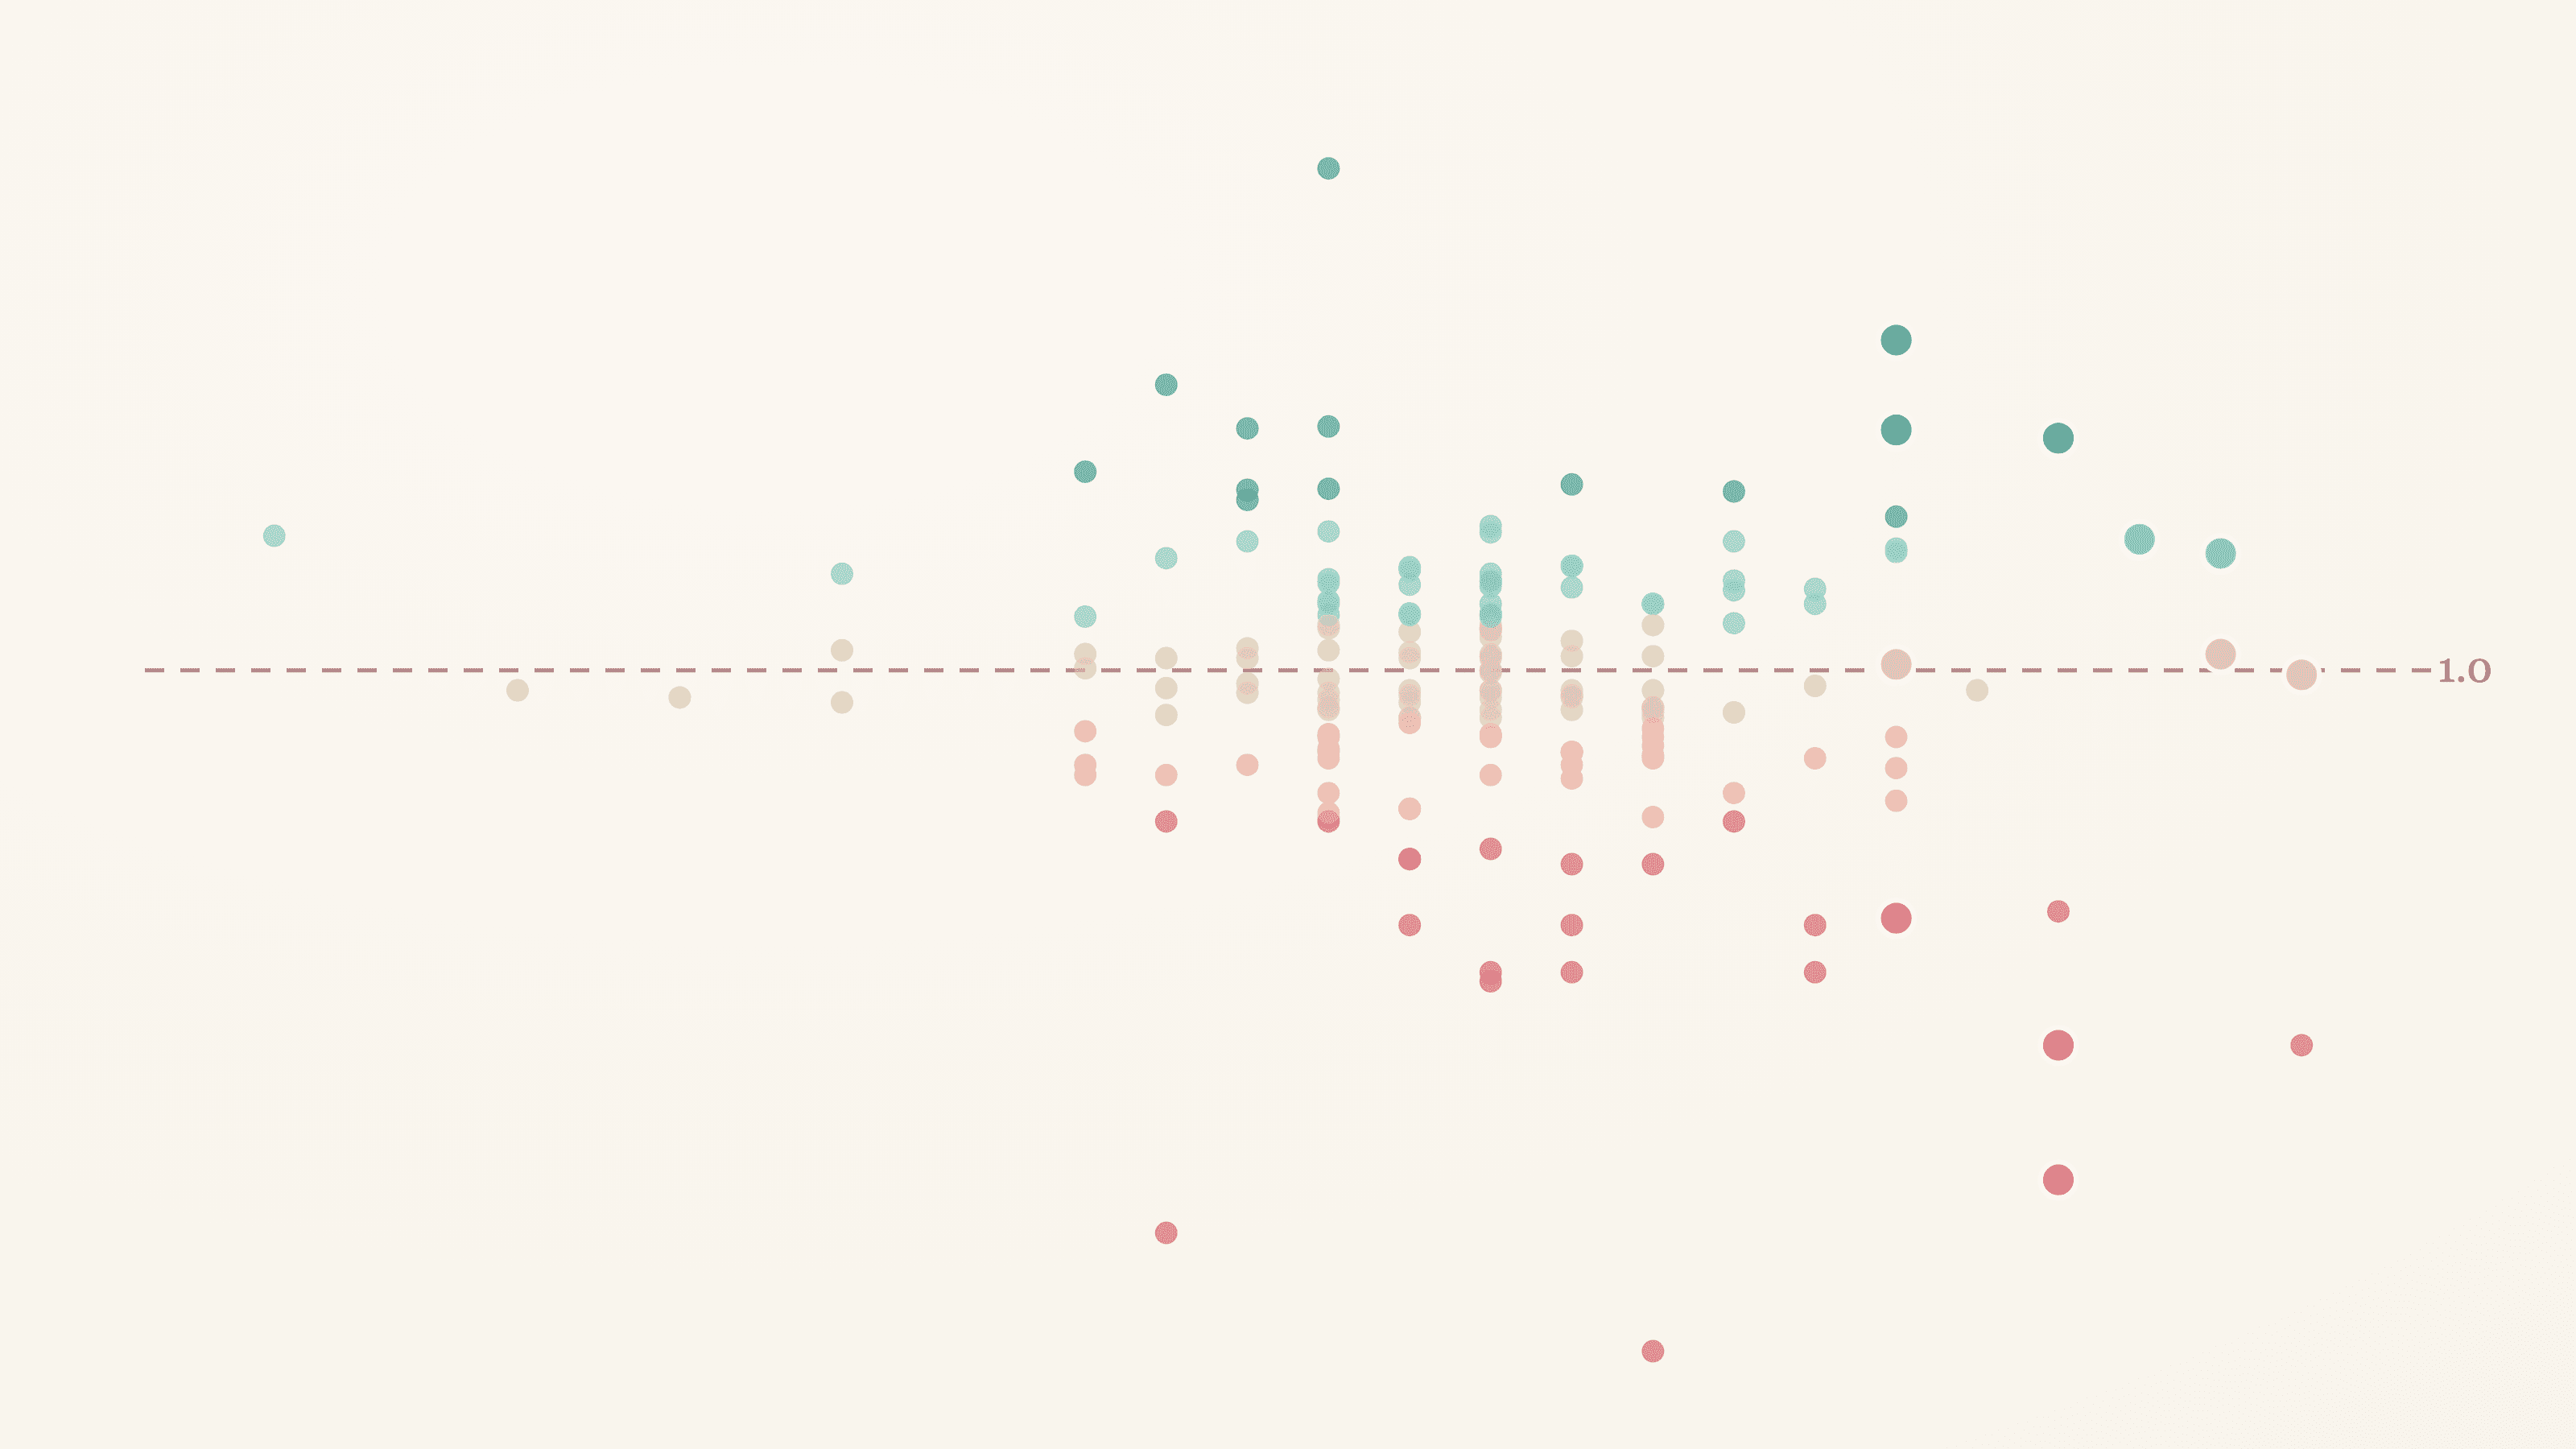
Quality and value are different axes
The deepest change is philosophical. The old QPR tried to be one number that meant "buy this". The new one refuses that job. Quality lives in the score; value lives in QPR; they are independent axes, and the catalog treats them that way:
The cloud is flat. Deals and rip-offs exist at every quality level, which is exactly what the residual construction promises. And this is why a cheap 3.6 with QPR 2.0 is not a trap anymore: the number honestly says "cheap for what it is", the score right next to it honestly says what it is, and if your taste lives in the 3.5 to 3.7 range, that is a genuinely useful signal. My own buy line stays at 3.8, so when you sort the catalog by QPR, wines above the line rank first no matter how spectacular a deal the plonk below it might be.
On the site this reads as a small badge next to the number: steal (2.0 and up), good deal (1.25 and up), fair (0.8 to 1.25), pricey (0.5 to 0.8), overpriced (below 0.5). The hover goes one step further and names the ceiling: the going rate for the wine's tier, which is the most you should pay before the deal stops being one. The bands are calibrated so the middle one covers the middle third of the catalog, and the current distribution sits at a median of 1.02, which is the closest thing to a health check a metric like this can have: half the catalog is priced about right for what it is, and the tails are where the action is.
The fine print
Every metric earns the right to be trusted by admitting where it wobbles.
- These are my scores, from my palate, mostly not blind. The literature politely calls this endogeneity: knowing a producer nudges a score, and prices correlate with producers. I try to score the wine and not the label, a good share of my ratings do come from blind tastings, and this is a personal metric, not a market instrument.
- The price is the highest public retail price I can verify, not what I paid. QPR is only as fresh as that price; prices re-verify on a daily crawl, and the USD anchor updates whenever the price does.
- My scale drifts as my palate does. A few of my early 5.0s I would place in the 4.3 to 4.7 range today. The tiers are built from tens to hundreds of wines each, so individual drift washes out of the ladder, but do not read any single old score as gospel.
- The top tier is thin. Only about two dozen ordinary still wines scored 4.6 and above carry prices, so that median moves when a few new icons enter. Medians resist outliers, but expect the top of the ladder to breathe. The style and format factors are point estimates from the same catalog: good approximations, not constants of nature.
- Bad wines are not cheap, they are just bad. The expected price below 3.5 ($19.9) sits a hair above the 3.5 to 3.8 tier ($19.2). I suspected outliers and went digging: the two distributions are practically identical (quartiles within a dollar of each other), and even trimming the priciest tenth of the failures barely moves the median. The real mechanism is selection. This catalog holds no true bargain-bin plonk, because I do not taste it; wines enter priced like decent bottles, and some of them betray the tag, with the dearest betrayals being mostly my hardcore-natural experiments. The consequence is worth stating plainly: below my buy line, price carries no quality signal at all in this data. Every slice from 2.5 to 3.7 hovers around the same $16 to $20, and the first real step of the ladder, $19 to $26, lands exactly on the 3.8 threshold. The ladder found my palate's edge on its own, and I find that the most honest little fact the whole system produced.
- The market moves under the metric. A stable currency does not make prices stand still: producers get discovered and repriced (ask anyone who bought Roses de Jeanne or Ulysse Collin a decade ago), and bottles that have left retail keep their last captured price forever. For those, QPR describes the deal I got, not the deal you can get today. Check the price date before you envy a number.
- The dollar inflates too, just slowly. The ladder self-updates daily, so unlike the old anchor nothing needs manual retuning, but comparing a QPR from today with one quoted years from now will carry that drift.
Further reading
If this itch feels familiar, the sources that shaped the rebuild:
- Priilaid and van Rensburg (2012), Nonlinear hedonic pricing: a confirmatory study of South African wines - the value and mispricing decomposition, and the bargains-at-the-top result.
- Oczkowski (2020), Estimating supply functions for wine attributes, AAWE WP 260 - the log-quadratic form winning the specification horse race.
- Costanigro, McCluskey and Mittelhammer (2007), Segmenting the wine market based on price - different price segments are different products.
- Kaimann, Spiess-Bru and Frick (2023), Ratings meet prices, Journal of Wine Economics - about 8 percent price per rating point.
- Nunez, Martin-Barroso and Velazquez, How much are we willing to pay for quality wine? A meta-analysis, Journal of Economic Surveys - the 223-study meta-analysis behind the 5 to 6 percent consensus.
- Wine Spectator on blind tasting - why a $40 and a $750 bottle can wear the same score.
- The Wine Gourd, Quantifying value-for-money wines - a practitioner reaching the same conclusion about raw ratios.
The formulas changed, the name stayed. QPR still answers the only question it ever had one job to answer: is this wine worth buying. It just finally answers it honestly.